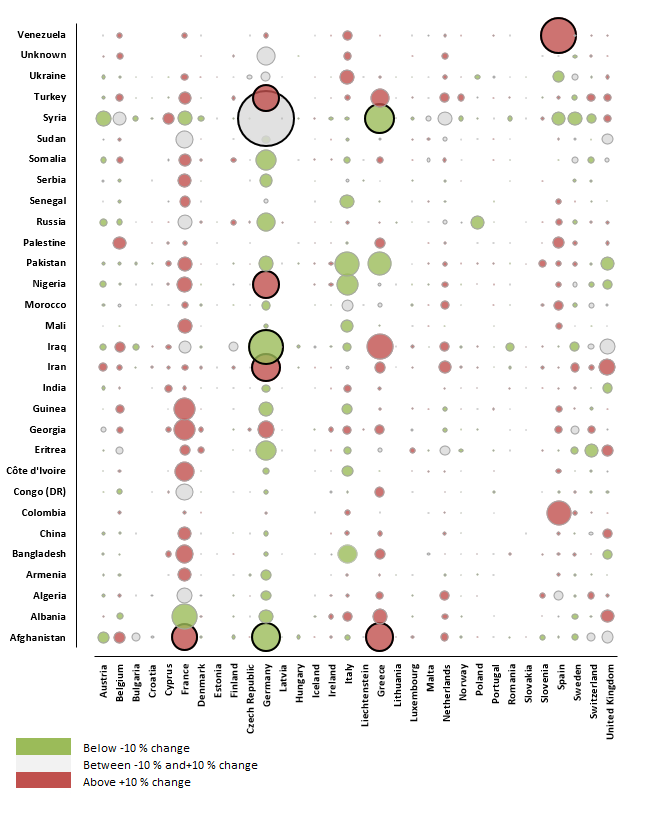
The main asylum flows, more specifically dyads of citizenships in receiving countries, provide a slightly more nuanced picture than separate considerations of countries of origin and receiving countries (Figure 8). The main influxes in 2018 were directed to Germany, France, Greece and Spain. Italy was not at the receiving end of any of the main flows despite being the fourth receiving country overall; this likely follows the decrease in specific citizenships applying in Italy and therefore also the diversification.
The ten main flows involved seven citizenships, all within the top ten citizenships of origin for 2018. Despite decreasing applications overall, Germany received not less than six of the ten largest influxes from specific citizenships: Syrians, Iraqi, Afghans, Iranians, Nigerians, and Turkish. Greece received two of the main flows (Syrians to Greece and Afghans to Greece). Both Spain and France only received one of the main flows: Venezuelans to Spain (the second largest specific influx into an EU+ country in 2018) and Afghans to France. Pakistani, Albanians and Georgians were among the top ten citizenships of origin in the EU+ overall, but were not among the top ten flows to specific EU+ countries. This means that these citizenships’ applications were less concentrated in one or a few countries.
Figure 8 highlights whether the specific flow increased by more than 10 %, decreased by more than 10 %, or remained relatively stable in 2018 compared to 2017. Six of the ten main flows increased: Venezuelan applicants to Spain; Nigerian, Iranian and Turkish applicants to Germany; Afghan applicants to Greece and to France. Syrian applicants to Germany remained stable, whereas about half of the flows that were directed towards Germany, including Iraqi and Afghans decreased compared to the previous year. In addition, Greece’s flow of Syrian applicants decreased, whereas a range of others increased. In Italy, most of the flows decreased, and in contrast in Spain, most of the flows increased.
|
Applications in 2018 by main country of origin, receiving country and extent of the yearly change |
|
 |
|
|
Figure 8: The composition of applicants and the yearly changes differed between EU+ countries |
![]()
![]()