The highest EU+ recognition rates were for applicants from Yemen (89 %), Syria (88 %) and Eritrea (85 %)125. The lowest share of positive decisions was for applicants from Moldova (1 %), North Macedonia (2 %) and Georgia (5 %).
The decrease in the EU+ recognition rate compared to 2017 was mainly due to the fact that recognition rates dropped for several citizenships of origin, and particularly for those with a high number of decisions issued. Lower recognition rates were evident for applicants from Somalia (54 % in 2018, or - 16 percentage points), Iran (40 %, - 15 p.p.), Iraq (43 %, - 14 p.p.), Eritrea (85 %, - 7 p.p.) and Syria (88 %, - 6 p.p.) 126. In contrast, upward variations took place for nationals of Venezuela (29 %, + 15 percentage points), China (42 %, + 13 p.p.), El Salvador (67 %, + 13 p.p.) and Turkey (48 %, + 12 p.p.). Despite having lower recognition rates, Moldova and Georgia were among the few countries of origin whose nationals lodged more applications compared to 2017.
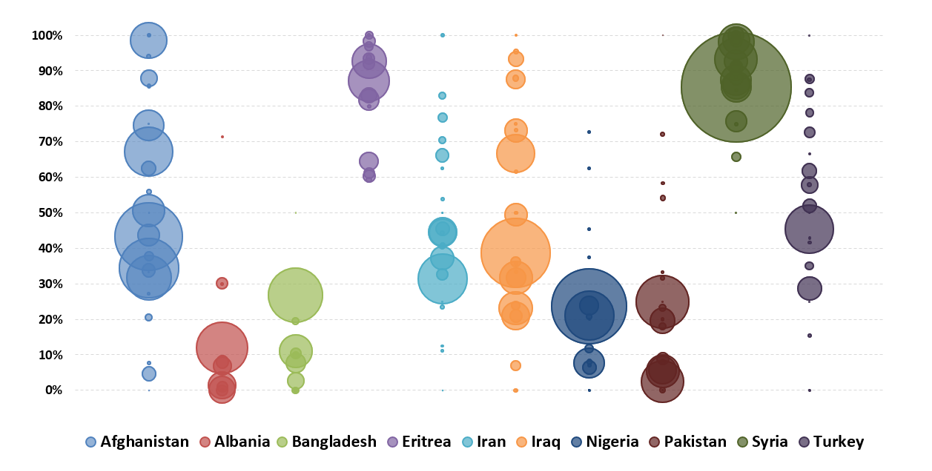
Apart from analysing the variation of recognition rates between citizenships, it is even more informative to assess how recognition rates for a specific citizenship vary across EU+ countries. Figure 16 shows that for applicants from Afghanistan, Iran, Iraq and Turkey, there continued to be considerable variation in decision-making practice across the EU+. Variation in recognition rates was more limited at relatively lower values of recognition rates. For instance, with regard to applicants from Albania, Bangladesh and Nigeria, there was more uniformity in the assessment of asylum applications. Variation in decisions’ outcomes was more limited also at relatively higher recognition rates, namely for Eritrean and Syrian applicants. Nevertheless, compared to 2017 there was somehow less agreement in the processing of Eritrean applications. In fact, in at least two EU+ countries issuing a considerable number of first instance decisions to Eritreans, recognition rates were considerably lower than in the rest of the EU+.
For individual citizenships, variation in recognition rates among EU+ countries may, to some extent, suggest a lack of harmonisation in terms of decision-making practices (due to a different assessment of the situation in a country of origin, a different interpretation of legal concepts, or due to national jurisprudence). However, to some extent it may also result from different profiles of applicants lodging applications in different countries. For example, from among applicants from the same country of origin, some EU+ countries may receive applicants with very different protection grounds, such as, for example, specific ethnic minorities, or people from certain regions within a country, as well as more applicants being unaccompanied children.
|
Distribution of 2018 recognition rates for citizenships with most first-instance decisions issued. Each bubble identifies a single EU+ country: its vertical placement represents the recognition rate, while the size of the bubble indicates the number of decisions issued. |
 |
|
Figure 16: For some citizenships, recognition rates varied widely between issuing countries |
____
125 For citizenships with at least 1 000 decisions issued in the EU+ in 2018.
126 For citizenships with at least 1 000 decisions issued in the EU+ in 2018.
![]()
![]()