
> Overview
See key facts and figures on EUAA training in 2022 as well as a focus on the response to the war in Ukraine.
> Training Activities
Here you can find more details about training activities carried out during the year.
> Observations&Trends
This section presents findings about delivery trends and learner feedback.
> EAC
Here you can find key figures and details about the European Asylum Curriculum modules.
Monitoring of training delivery
Ongoing monitoring of training enables the EUAA to follow the training activities and to find out, at an early stage, how an activity is performing based on a number of criteria. The monitoring data allows for an analysis of the “state of play” and can identify the need to rectify certain aspects of the training activities. The data is compiled into an aggregated annual monitoring report, identifying both best practices as well as areas for improvement to be highlighted and analysed. The monitoring covers all training sessions delivered, including training activities delivered in the framework of permanent and operational support, as well as training activities delivered as part of capacity building in third countries under the external dimension of the Common European Asylum System (CEAS).
With an aim to improving data collection and the quality of the data collected, 2022 saw a revision and improvement of the feedback forms and the inclusion of additional data to the monitoring report (e.g., response rates and ranking).
A consistently high 95% and above, overall satisfaction rate
Above 95% of the participants said the training had contributed to their professional knowledge, skills and/or growth.
Close to 100% of learners who responded, stated that the trainer was knowledgeable and well prepared.
Overall context of training delivered in 2022
During 2022, one of the biggest challenges facing EUAA operations was the need to rapidly support persons fleeing the war in Ukraine. This included implementing the newly activated Temporary Protection Directive. At the same time, there was an increase in the overall level of operational support provided with new operating plans signed with additional Member States. The operating plans, which included a training component during 2022, increased with five new plans signed with Belgium, Bulgaria, Czech Republic, Latvia and Romania in addition to six existing operating plans. An operating plan was also signed with the Netherlands1. The delivery of training is generally a substantial part of each operating plan and clearly affects the overall number of training sessions delivered during the year. This is reflected in the marked increase in training sessions and higher level of participation compared to 2021.
Training needs analysis
Prior to commencing the delivery of training, it is necessary to ensure that the training provided meets the needs of Member States. During 2022, training needs assessments were carried out in Austria (Oct 2022), Bulgaria (June 2022), Cyprus (July 2022), Czech Republic (April 2022), Netherlands (February 2022), Romania (March & Sept 2022), Slovenia (Sept 2022), Spain (Aug 2022). Several operating plans which were active during 2022 continued implementing training in accordance with training needs analysis carried out in 2021.
It should be noted that new training can be implemented quickly, for example in the case of Romania. A training needs assessment was carried out in March and, by April, newly designed and developed training specifically focused on temporary protection was being delivered.
Proportion of training delivered under permanent and operational support
Of the total 12 874 participations recorded in 2022, 63 % (8 157) were part of operating plans and 31% (3 929) were under permanent support. The increase in operational support started already in Q2 of 2022. There was a clear shift in focus in the delivery of training compared to 2021 when permanent support was 53% (3 966) while operational support only 43% (3 207). The overall number of participations increased by 72% in 2022 (12 875) compared to 2021 (7 472) while the number of participations recorded under operating plans saw a 154% increase over 2021. This is partly due to the response to the war in Ukraine. In Q2, 47 training sessions were organised to support in the implementation of the Temporary Protection Directive with 1 150 participations; 78% of which were under operating plans. It is clear that EUAA has managed to both shift its focus to meet the demand as well as substantially increase the delivery of training.
Training under the temporary protection framework
Of all persons who completed training during 2022, 12% received training in the context of responding to the war in Ukraine. As the sessions were linked to a specific context, they were registered under the scope of temporary protection. A total of 1 179 participations were recorded. The overall satisfaction rate is 96% although it should be noted that the response rate is low for sessions under this framework. This could be due to the context and urgency of the training resulting in less emphasis being put on gaining feedback from learners.
When looking into which countries received the training, the largest recipients are Romania (37%), Greece (17%), Italy (10%), Sweden (7%) and Spain (5%) with lower numbers for the other 19 Member States that have received training on temporary protection. The figure below shows the the number of non-EU citizens who fled Ukraine and benefitted from temporary protection during 2022. It is interesting to note that not all the neighbouring Member States made use of the temporary protection training arranged by EUAA.
"The course helped me better understand how the directive applies to the context of Romania and the rights that temporary protection beneficiaries have. It was very useful that we had the opportunity to discuss concrete cases and the difficulties we encounter".
Testimonial from learner who took part in the training on implementing the Temporary Protection Directive
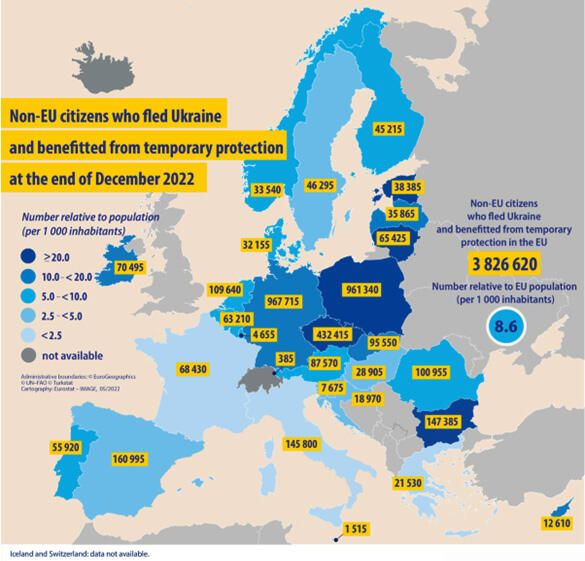
Source: Temporary protection for persons fleeing Ukraine - monthly statistics. Eurostat - statistics explained (Archived here).
In order to provide the training rapidly, it is interesting to see how the training was arranged in practice. The majority 73% (1 018+77) were trained using the format webinar or online only which is an efficient delivery format that can reach many participants in a short period of time in different settings. It should be noted that the satisfaction rate does not differ between the different delivery types.
Training trends in 2022
Participation in training activities varied over the year
As seen in the summary table below, the level of training activity is generally higher during Q2 and Q4. This could be seen as quite a normal planning phenomenon in organisations but could be analysed further to see if the actual demand is lower or if it is the internal planning cycle of both Member States and EUAA that create the difference. With more operational plans in place, it could be expected that delivery of training could be more even during the year.
Training content with high participation
| Content | Sessions | Participations | Average of satisfaction rate | Average response rate |
|---|---|---|---|---|
| Module: Introduction to the legal framework on fundamental rights and international protection in the EU | 35 | 896 | 96% | 94% |
| Tailor-made: Temporary Protection | 36 | 809 | 96% | 33% |
| Standard course: EUAA pre-deployment induction training | 16 | 705 | 94% | 83% |
| Module: Trafficking in human beings | 41 | 691 | 96% | 59% |
| Module: Inclusion | 53 | 669 | 95% | 30% |
| Module: Introduction to ethical and professional standards | 28 | 528 | 96% | 93% |
| Module: Evidence assessment | 45 | 526 | 95% | 27% |
| Module: Interviewing vulnerable persons | 49 | 487 | 95% | 26% |
| Module: Reception | 40 | 486 | 92% | 31% |
| Module: Introduction to vulnerability | 29 | 470 | 94% | 88% |
None of the top 10 most delivered content have a satisfaction rate below 92%. This is positive bearing in mind the high number of participations in these modules. However, the response rate for the tailor-made module on Temporary Protection has a low response rate, as well as the modules on Inclusion, Evidence Assessment, Interviewing vulnerable persons and Reception. Therefore, the satisfaction rate of those modules should be viewed with caution.
Stable satisfaction rates
The satisfaction rates for all training activities remained stable throughout the 4 quarters where Q1 had 96% and Q2-Q4 95% giving an overall satisfaction rate of 95%. Since the feedback forms (including the Likert scale) was changed during 2022 the satisfaction rate cannot be compared with 20212. When looking at satisfaction rates linked to the different delivery types, the picture is a bit different. 'Webinar only' receives the highest while 'online and webinar' or 'face-to-face' has a lower satisfaction rate.
| Content | Sessions | Participations | Average of satisfaction rate | Average of response rate | Number of enrolments |
|---|---|---|---|---|---|
| Face-to-face only | 76 | 1125 | 96% | 33% | 1273 |
| Online and face-to-face | 481 | 6311 | 95% | 42% | 7647 |
| Online and webinar | 46 | 548 | 94% | 75% | 764 |
| Online only | 178 | 3199 | 95% | 85% | 4724 |
| Webinar only | 106 | 1692 | 97% | 49% |
2027 |
| Total | 887 | 12875 | 95% | 52% | 16435 |
To compare satisfaction rates between Member States is difficult due to the wide difference of response rates.
Satisfaction rates - how are they calculated?
On completion of training, learners are asked to complete a feedback form. A number of the questions use a Likert scale to gauge the level of satisfaction. In 2022, a four-point scale was used "strongly agree, agree, disagree, strongly disagree". The Likert scale used in 2022 did not include a neutral feedback as an option and therefore it is not possible to capture more neutral feedback. This will be reinstated for 2023 monitoring.
Completion rates
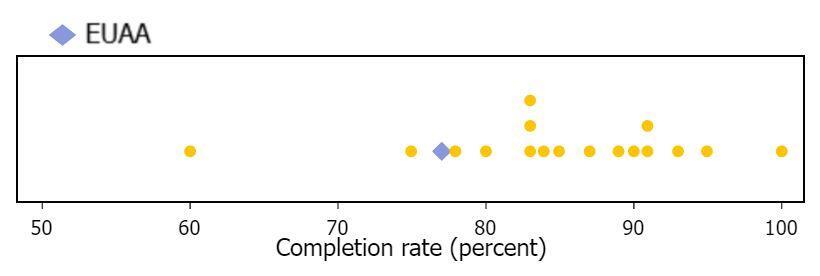
The overall completion rate for 2022 is 78% (the same as in 2021) and ranges from 60% to 100% when broken down by quarter. Both Member States and the EUAA (with 61% of the arranged sessions and a lower completion rate), could benefit from more information on the reason for low completion rates and this is investigated for 2023.
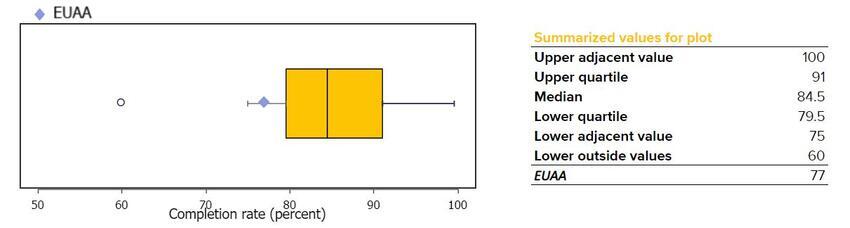
The boxplot above shows the the distribution of completion rates across Member States, overlaid with a purple diamond indicating the value for EUAA. Half of Member States fall within the yellow box which is bisected by the median value. The dotplot on the right shows completion rates as percentages for each Member State. Where more than one Member State has the same value, their symbols are stacked vertically.
Positive and negative feedback
Several of the questions in the feedback form provided to learners asks them to rate their level of satisfaction according to a four-point Likert scale. When making a deeper analysis of the overall positive and negative feedback received it can be noted that almost 59% gave the highest positive feedback and just under 37% are positive.
Overall satisfaction measured by response to the question: I am satisfied with this training!
Based on 7450 replies to this question 61% strongly agreed, nearly 37% agreed and just over 2% disagreed or strongly disagreed during 2022. This confirms that the participants in general find the quality of the different modules to be of a good standard based on the data available.
Quality of the trainers
Based on 7785 replies to the question below a very high number 79% strongly agreed that the trainers were knowledgeable about the subject matter and almost 21% agreed. Only 0.5% disagreed. It can be interpreted that learners find their trainers to be highly knowledgeable of the subject matter.
Time invested in training
The question of invested time is frequently noted in the text comments. Most of the comments refer to a general lack of time due to workload or the time indicated for the different sub-modules does not correspond to the time needed. There is a specific question about this aspect in the feedback form. When analysing those replies separately, it shows a lower satisfaction rate of 93%. The rest, 7% disagree as can be seen in the graph.
Improvement of response rates
Efforts to improve the response rates have been made during 2022. In particular Member States have submitted more feedback data in time for inclusion in the quarterly monitoring reports. The response rates continue to differ between the organisers, which makes the data less accurate. It also means that EUAA does not receive qualitative feedback from a number of Member States. Therefore, examples of good practice or suggested improvements are not identified.