
4.2.7. Implementing Dublin transfers

After dropping to very low levels on account of the COVID-19 pandemic in 2020 and 2021, the number of Dublin transfers which were implemented in 2022 remained low. Overall, about 15,000 transfers were undertaken in 2022,xxixwhich was about one-seventh more than in 2021, yet about two-fifths lower than the number in 2019. Transfers were partially hampered by the increased pressure on staff and reception systems following the activation of the Temporary Protection Directive in the wake of the Russian invasion of Ukraine.
In 2022, implemented transfers fluctuated moderately throughout the year (see Figure 9). The low number of transfers in 2022, combined with a slight increase in accepted requests, resulted in a lower ratio of implemented transfers to accepted requests: just under one to seven,xxx down from one to five in 2021 and one to four in 2020.xxxi
A low number of Dublin transfers were implemented in 2022
Figure 9. Number of outgoing Dublin transfers implemented in EU+ countries by month, January 2019–December 2022
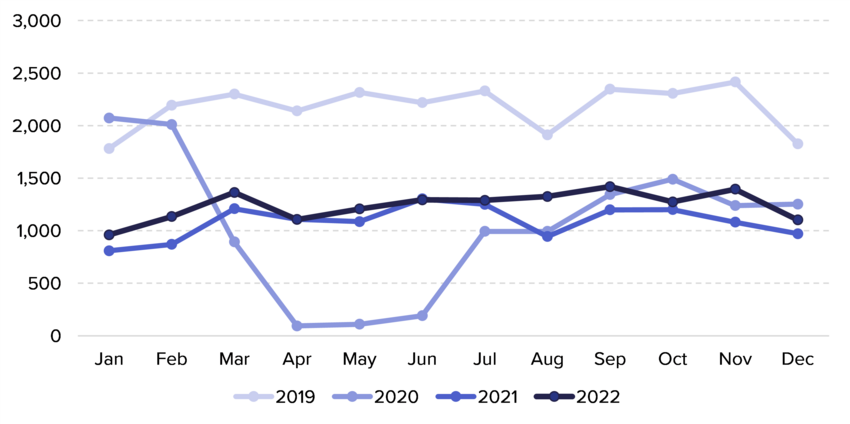
Source: EUAA EPS data.
Germany and France implemented one-half of all transfers in 2022. Transfers implemented by Germany increased by about three-fifths compared to 2021 (see Figure 4.10, left side). The surge was mainly due to many more Afghan, Syrian, Turkish and Iraqi applicants (in descending order) who were transfered. Transfers implemented by France increased by one-tenth from 2021 and continued to involve mainly Afghans and Guineans.
Among the countries implementing the most transfers, Greece undertook less than one-half as many transfers as in 2021 (on account of an important drop in Afghan transfers), while those carried out by the Netherlands remained stable.
Germany and France implemented one-half of all Dublin transfers
Figure 10. Number of outgoing Dublin transfers implemented by sending (left) and receiving country (right) for selected countries, 2022 compared to 2021
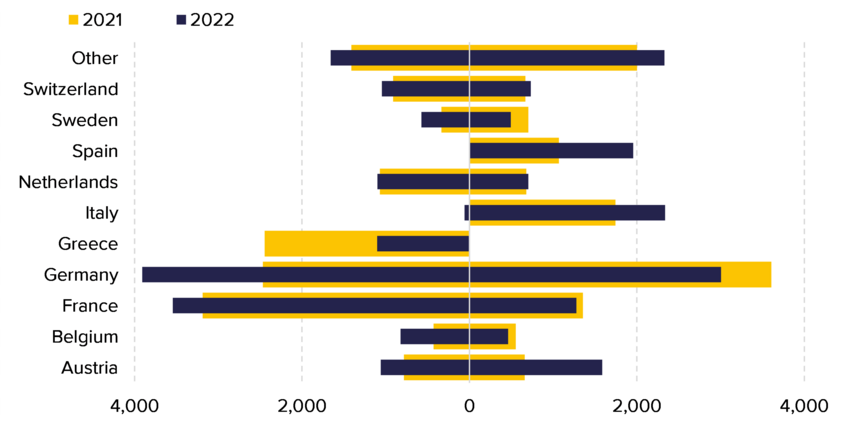
Source: EUAA EPS data.
At lower levels, more transfers were implemented by Austria (where Afghans remained the top transferees but numbers grew considerably for Algerians, Indians and Moldovans), Belgium (due to more Algerians, Afghans and Moroccans), Portugal (due to more Gambians) and Sweden (on account of an unprecedented number of transfers of Russian and Uzbek nationals).
The largest absolute increases in receiving countries occurred in Austria, Spain and Italy (in descending order) (see Figure 10, right side). Transfers to Austria increased to the most in at least 6 years, mainly due to more Afghans, Syrians and Turks. Such increases were offset by declines in Germany, Romania, Sweden and Belgium (in descending order), mainly driven by fewer transfers of Afghans.xxxii
As in the previous year, in 2022, most transferees were Afghans, accounting for just under one-fifth (17%) of the total. They were followed at some distance by Algerians (8%), Syrians (7%), Guineans, Moroccans and Iraqis (5% each). The transfer of Afghan nationals declined by one-tenth from 2021 but remained above the pre-pandemic level of 2019. Germany transferred more than twice as many Afghan citizens as in 2021, while transfers of Afghans from Greece declined by almost two-thirds to the lowest level in at least 6 years.
Around 1,200 Algerians were transferred in 2022, which was about one-sixth more than in the previous year and the most in at least 7 years. Transfers of Syrians increased slightly compared to 2021, while transfers of Iraqis and Moroccans both rose by more than one-quarter. In contrast, after dropping in 2020 and 2021, transfers of Nigerians declined further in 2022.
Most asylum applicants who were transferred through a Dublin procedure in 2022 were adult males (see Figure 11), but children under 18 years represented at least 14% of all transferees.xxxiii In 2022, transfers of minors declined by around one-fifth compared to 2021, but there were variations between the age groups. While the transfer of minors in the younger age group (under 14 years of age) remained stable, significantly fewer minors aged between 14 and 17 were transferred. The decline was due to a steep fall in the number of minors transferred from Greece, likely linked to fewer transfers executed under the relocation scheme. Nevertheless, Greece remained the top country for the implementation of transfers involving minors, carrying out two-fifths of all such transfers, but it was followed closely by Germany, which accounted for around 30% of the total.
Transfers of female minors remained stable compared to 2021, with minor girls representing one-third of all transferred minors. In the lower age group (under 14 years), minor girls represented roughly two-fifths of the total.
The number of minors being transferred declined for the top two nationalities of transferees
Figure 11. Transferees in the Dublin procedure by age group and sex, 2022

Source: EUAA EPS data.
As in previous years, most minors who were transferred in 2022 were Afghans, followed at a distance by nationals of Syria, Pakistan, Iraq, Türkiye, Russia, Somalia and Bangladesh (in descending order). Transfers of Afghan and Syrian minors declined by around one-half and over two-fifths, respectively from the previous year, whereas those involving Pakistani minors remained stable. Conversely, transfers of Iraqi minors increased by more than one-third. Overall, the main receiving countries for children were Germany, Italy, Switzerland, France and Spain (in descending order).
- xxixData were missing for Denmark.
- xxxThis calculation was made excluding data for Denmark for 2022.
- xxxiThe ratio of transfers following accepted requests should be used with caution to assess a Member State’s capability to successfully implement transfers, due to the lack of cohort data and a substantial time lapse between an accepted transfer request and a physical transfer. This time lapse distorts the calculation of the rates if the number of acceptances is not stable over time.
- xxxiiOnly countries where the surplus of transfers in 2021 compared to 2022 exceeded 140 are considered.
- xxxiiiThis proportion includes transferees for whom EU+ countries had not reported the age, which accounted for 13% of the cases.