
3.13.1.3. Divergence in recognition rates
Variations in recognition rates can be used to analyse the extent of convergence or divergence among decisions to grant international protection in different EU+ countries. This is calculated using the standard deviation of recognition rates across EU+ countries for a given citizenship. Figure 19 presents the monthly evolution of this variation for the Top 5 nationalities of applicants – Syrians, Afghans, Venezuelans, Turks and Georgians (in descending order) – who were issued the most decisions in 2022 and 2023.xxxix
In general, a variation score between 0 and 0.1 is considered to be low, between 0.1 and 0.25 as medium, and above 0.25 as high.xlAs seen in Figure 19, Venezuela had the highest variation in recognition rates in the past 2 years, as the monthly scores always remained above 0.42 and were often above 0.45. Nationals of Türkiye also had continuously high variation in recognition rates, with the standard deviation oscillating around 0.3.
More convergence in decision-making was seen for Syrians and Georgians. While decisions were more divergent for Syrian applicants in the second half of 2022, this changed in 2023, particularly in the last 4 months of the year. For Georgian applicants, variation was minimal in a consistent way until April 2023 (with the monthly scores almost always falling below 0.1). Variation in decisions on their applications then fluctuated around a medium level for the remainder of the year.
Figure 19. Monthly variations in recognition rates (standard deviation) across EU+ countries for the Top 5 citizenships receiving the highest number of first instance decisions issued, January 2022–December 2023
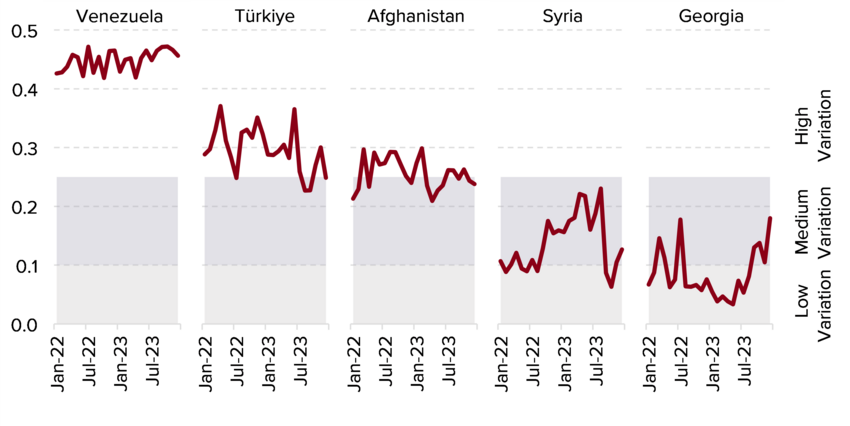
Source: EUAA EPS data as of 1 February 2024.
- xxxixOnly EU+ countries that issued at least 200 decisions for the five citizenships in both 2022 and 2023 were considered. Countries that issued fewer than 17 decisions (200 divided by 12 months) on a monthly basis were excluded.
- xlVariation is measured on the scale from 0 to 0.71, whereby a standard deviation of 0 denotes no variation in recognition rates among the countries in the given period and 0.71 denotes the maximum extent of variation in recognition rates among the countries. Theoretically, scores up to 0.71 are possible but in practice such a score could only be reached if there would be only two countries in the sample – one with a recognition rate of 100 % and the other one with a recognition rate of 0 %. Hence, the actual score could hardly reach a value higher than 0.6. This consideration has informed the way the categories for low/medium and high deviation were set.