
Number of applications To better interpret the impact of asylum-related migration at the country level, it is important to analyse socio-economic indicators and the geographical area of a country for a more contextual perspective. While one country may receive fewer applications than another overall, its capacity to absorb more applicants may not be comparable. This perspective gives a more proportional interpretation of the situation of asylum currently and reinforces the essential role of solidarity and sharing responsibility within the context of asylum in Europe.
Turning from absolute to relative numbers, Cyprus, Greece and Malta received the most applications for international protection relative to their population sizes (see Figure 4.22), based on EASO calculations. Cyprus, with the highest number of applicants in relative terms, had one of the sharpest increases in the number of applications in 2019, an increase of + 76 % compared to 2018. Malta received the most applications relative to its area (85 times higher than the EU+ baseline, which represents the total number of applications relative to a variable), despite receiving just 0.5 % of all applications lodged in EU+ countries. Greece ranked relatively lower in relation to its area, but pressure was particularly concentrated in the hotspots, indicating that also relative estimates could be further contextualised at the sub-national level.
Figure 4.22 presents three indicators which rank the number of applications for international protection relative to population size, the area of a country and the national gross domestic product (GDP). Population and country sizes can provide a perspective on the capacity to absorb applications, while the GDP can shed light on a country’s capacity to integrate refugees. Most countries rank similarly across the three variables, indicating a correlation across the indicators, but there are some notable exceptions.
The countries shaded in blue received a relative volume of applications lower than the EU+ baseline, for example countries located in Eastern Europe and the Baltic region. Yet in absolute numbers, several of these countries registered many more applications in 2019 than in 2018. It is worth noting that, while receiving the fifth and sixth highest number of applications in absolute terms, the United Kingdom and Italy ranked below the EU+ baseline in relative terms when considering population, country size and GDP.
On the other side of the spectrum, countries that received a higher number of applications than the EU+ baseline in relative terms also featured in the Top 10 countries with the highest number in absolute terms. In particular, Belgium and Spain stand out in this pattern, along with France and Germany. Of particular note is the case of Luxembourg, which was one of the Top 5 countries in relative terms (as also indicated by long-term pressure on its reception system) but received just 0.3 % of the overall EU+ caseload.
Pending cases
Analysing cases awaiting a final decision in relation to the population size of a country offers an informative perspective of the relative pressure on national asylum and reception systems. The two indicators are stock measures and compare two different populations – those of asylum applicants and of the general population – at the same moment in time (end of the year). As such, this technique offers an estimate of the density of the population of applicants for international protection relative to the overall national population.
Cases may be pending in appeal with second instance determination bodies (for Member States in which these bodies take decisions on the merits of each application) or in review with first instance authorities (in Member States where second instance determination bodies issue an order to first instance determination bodies to review the case).
This indicator shows that at least nine EU+ countries had more pending cases relative to their population sizes than EU+ countries as a whole (see Figure 4.23). Again, Cyprus, Greece and Malta were under the highest pressure, reasonably as a result of a persisting inflow of asylum applications. Cyprus faced the largest relative backlog, with more than 2 000 pending cases for every 100 000 inhabitants. In relative terms, Greece and Malta also had many more open cases than the rest of the EU+ countries, but less than one-half that of Cyprus. Yet in absolute terms, Greece and Malta accounted for slightly more than 14 % of all applications awaiting a final decision in the EU+, the majority of which were in Greece.
Germany followed at a distance, with fewer than 400 cases open for every 100 000 inhabitants in relative terms – but this still represented more than twice the EU+ baseline. In absolute terms, Germany accounted for more than one-third of all open cases in Europe, the vast majority of which was estimated to be pending in appeal or review.
Figure 4.22 Applications for international protection in 2019 relative to population size (2019), country size (2015) and GDP (2018)

Notes: Countries are sorted by the number of applications relative to population size (from higher to lower volumes, indicated by the arrow). The shades indicate the number of relative applications received compared to the EU+ baseline.
Source: Eurostat.
A large number of cases pending with bodies examining applications at second or higher instances was likely the main explanation for the high number per capita in Austria and Sweden. Both countries received a considerable volume of applications between 2015 and 2016 but much fewer since. The remaining countries with more pending cases than the EU+ average were all subject to rising asylum trends in 2019 and, in turn, had increases in the number of open cases.
Similar considerations can be made for EU+ countries falling below the EU+ baseline. In spite of a low absolute number of pending cases, Iceland (425) seemed to be subject to a relative pressure higher than for France or Italy. Most Eastern European countries had a very low number of pending cases, both in absolute and relative terms, resulting in limited pressure on their national asylum systems.
Figure 4.23 Number of cases awaiting a final decision relative to population size in EU+ countries, December 2019
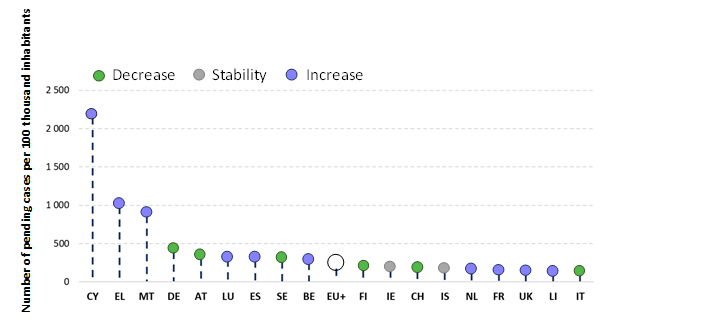
Note: The colours of the caps indicate the degree of change from 2018 (decrease - 10 %; increase > + 10 %). EU+ countries with fewer than 50 pending cases for every 100 000 inhabitants are not displayed.
Source: Eurostat
Previous |
............... |
Home |
................... |
|
Next |